External Data Becomes Actionable
A Walk Through How Eclipse Works
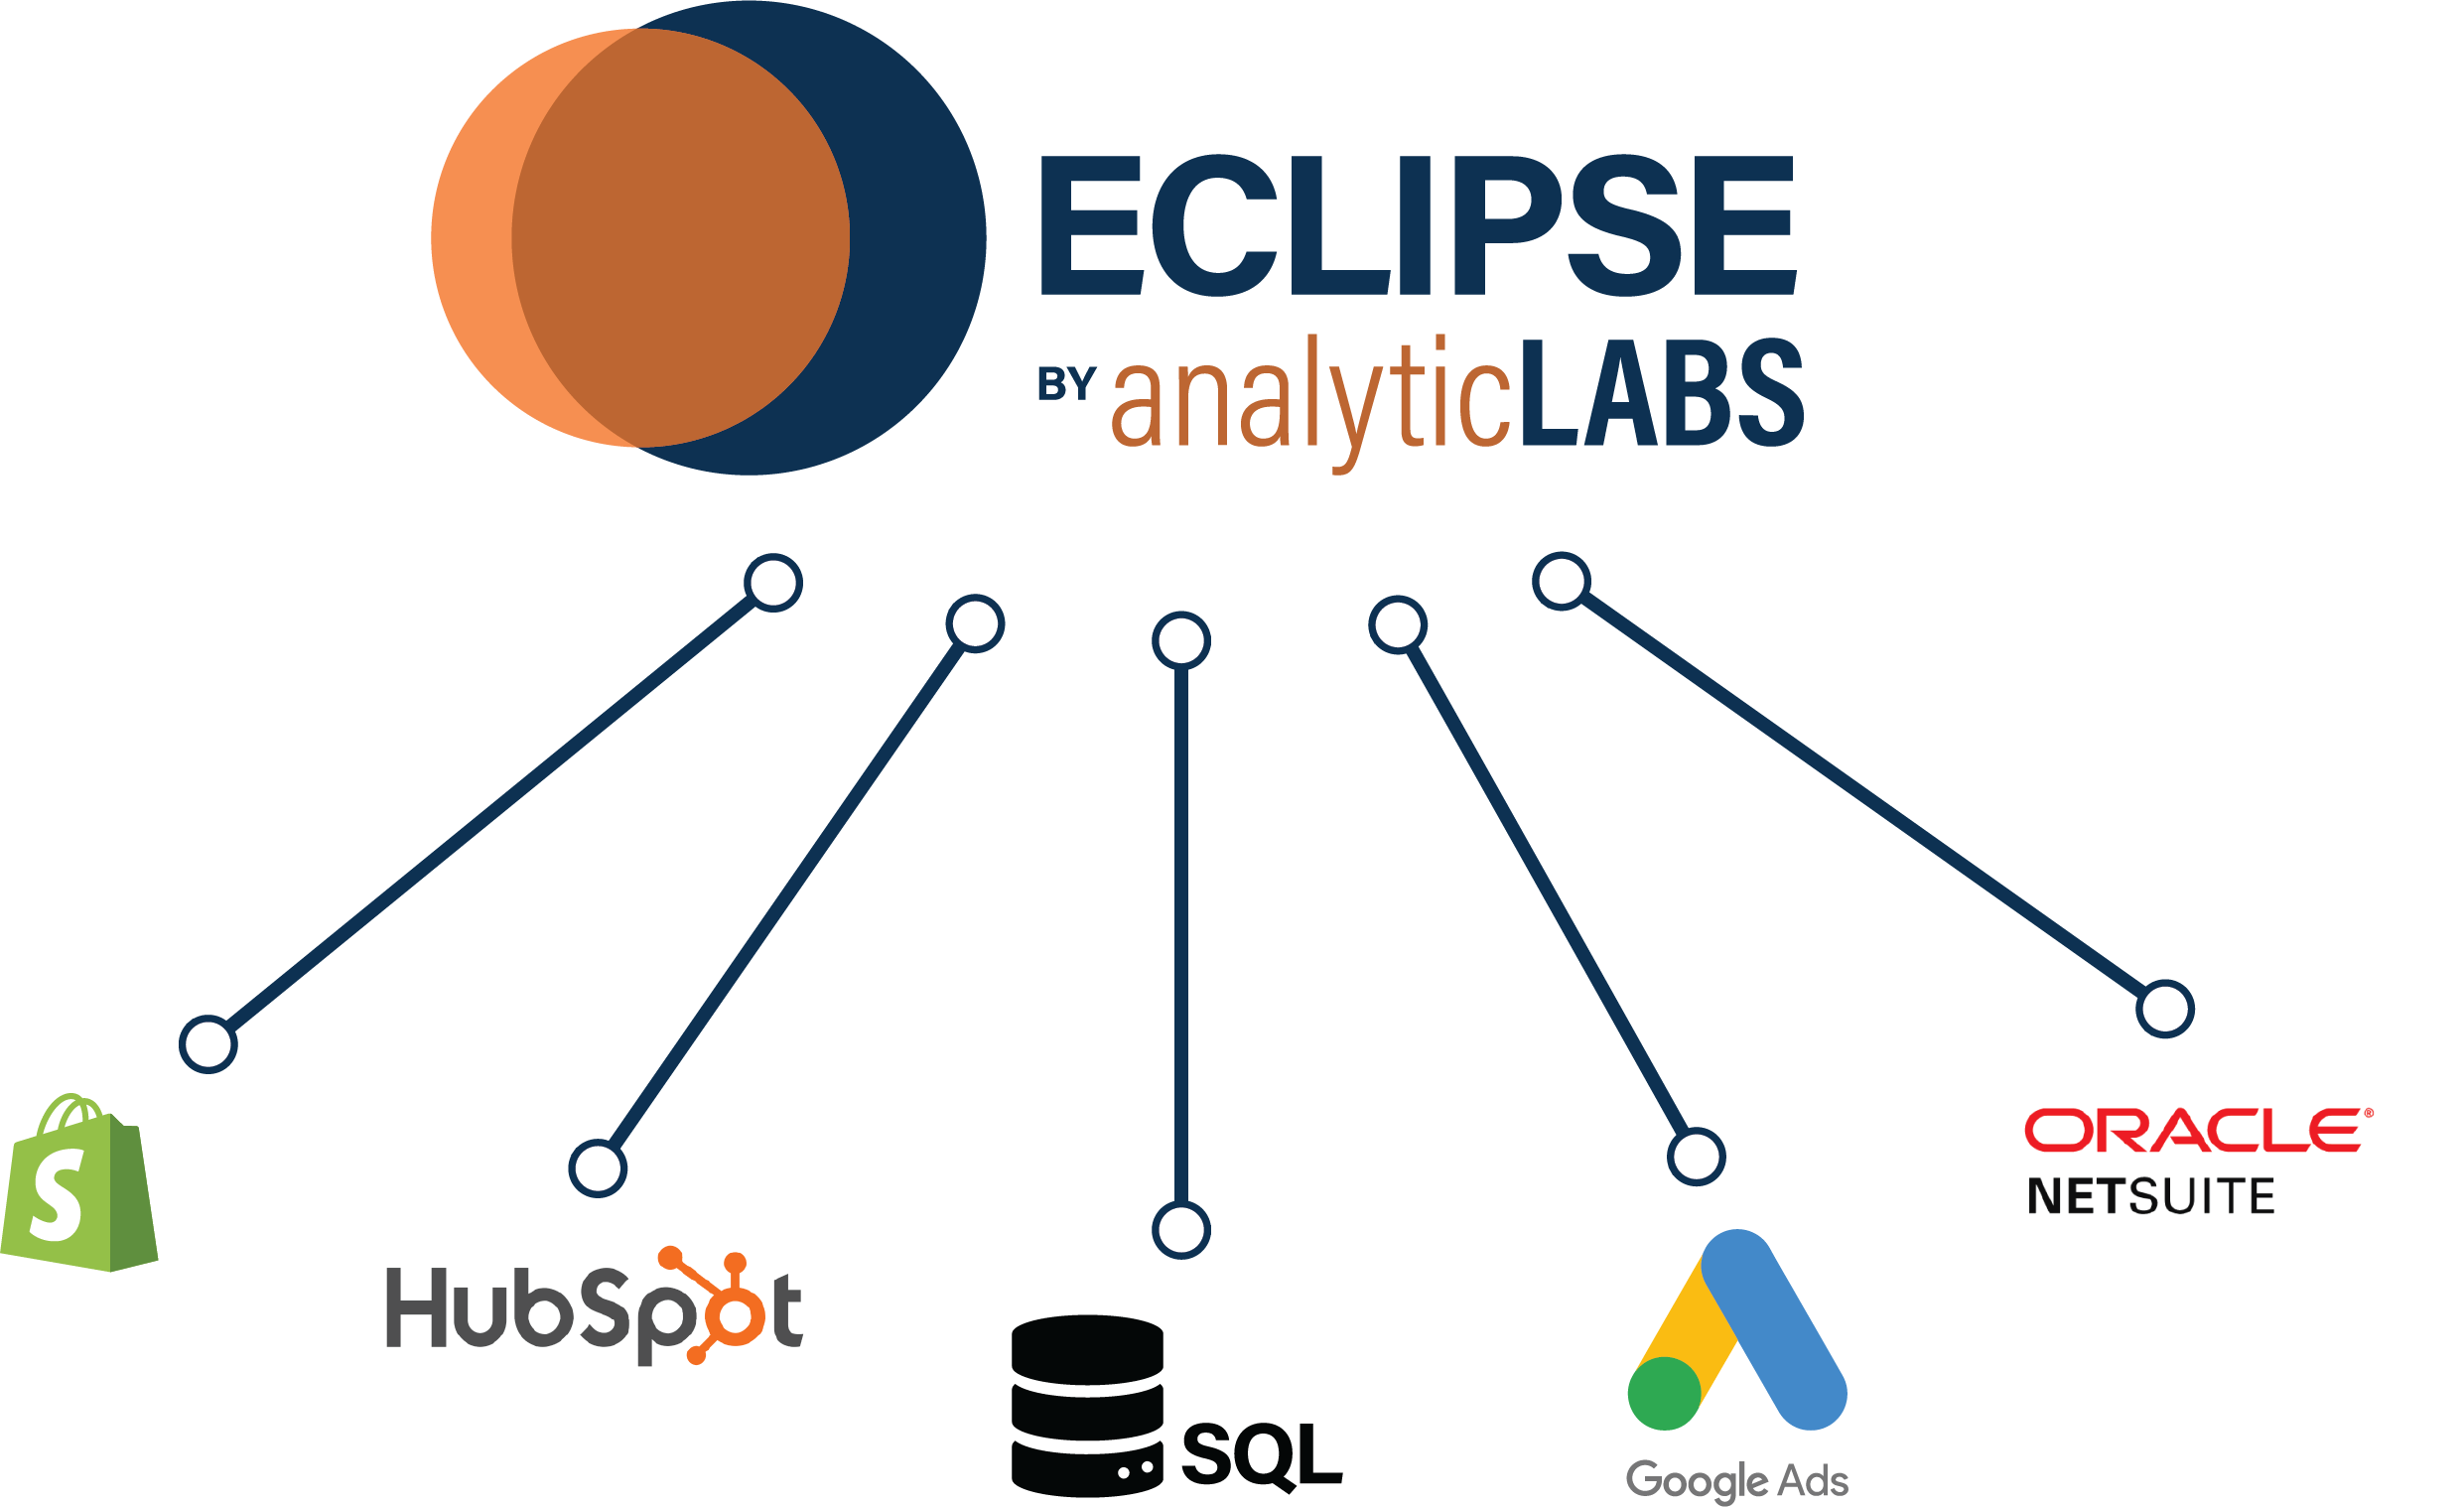
Eclipse’s interfaces collect data from wherever your business generates it, sending it to our core system. Eclipse is your business’ central nervous system, making holistic, business-building meaning out of what could have been just useless information.

Eclipse’s interfaces collect data from any source, on site or in the cloud. We’ll customize interfaces for your in-house apps. We’ll work with vendors to access cloud data through APIs. You'll even have access to our own library of data sources and data partners. In the end, you’ll know you’re collecting all the information that’s relevant to your decision-making. Plus, because our interfaces are smart, they can format data even when data streams change shape. You won’t ever be missing anything.

What's a data source?
Here are a few examples:
- Business systems such as ERP, CRM, eCommerce, HRIS
- External data sources such as Census, Foreign Exchange, or weather
- Competitive data such as consumer research, sales data, and market information
 About Eclipse
Why send all data to Eclipse? As your business’ central nervous system, its job is to make big picture sense of all the information generated by your business activities. The idea is to understand the relationships between data points; after all, seeing these patterns drives essential, business-building insights. Because everything goes to one place, those patterns emerge easily and reporting just works.

What does a relationship between data points look like?
Here are a few examples:
- Statistical relationships to demonstrate how marketing campaigns impact revenue
- Placement relationships to demonstrate how eCommerce site optimization helps clients quickly find and purchase your goods and services online
- Traffic analysis to Illustrate the relationship of vehicle and foot traffic to both store and eCommerce revenue gains
About Reporting
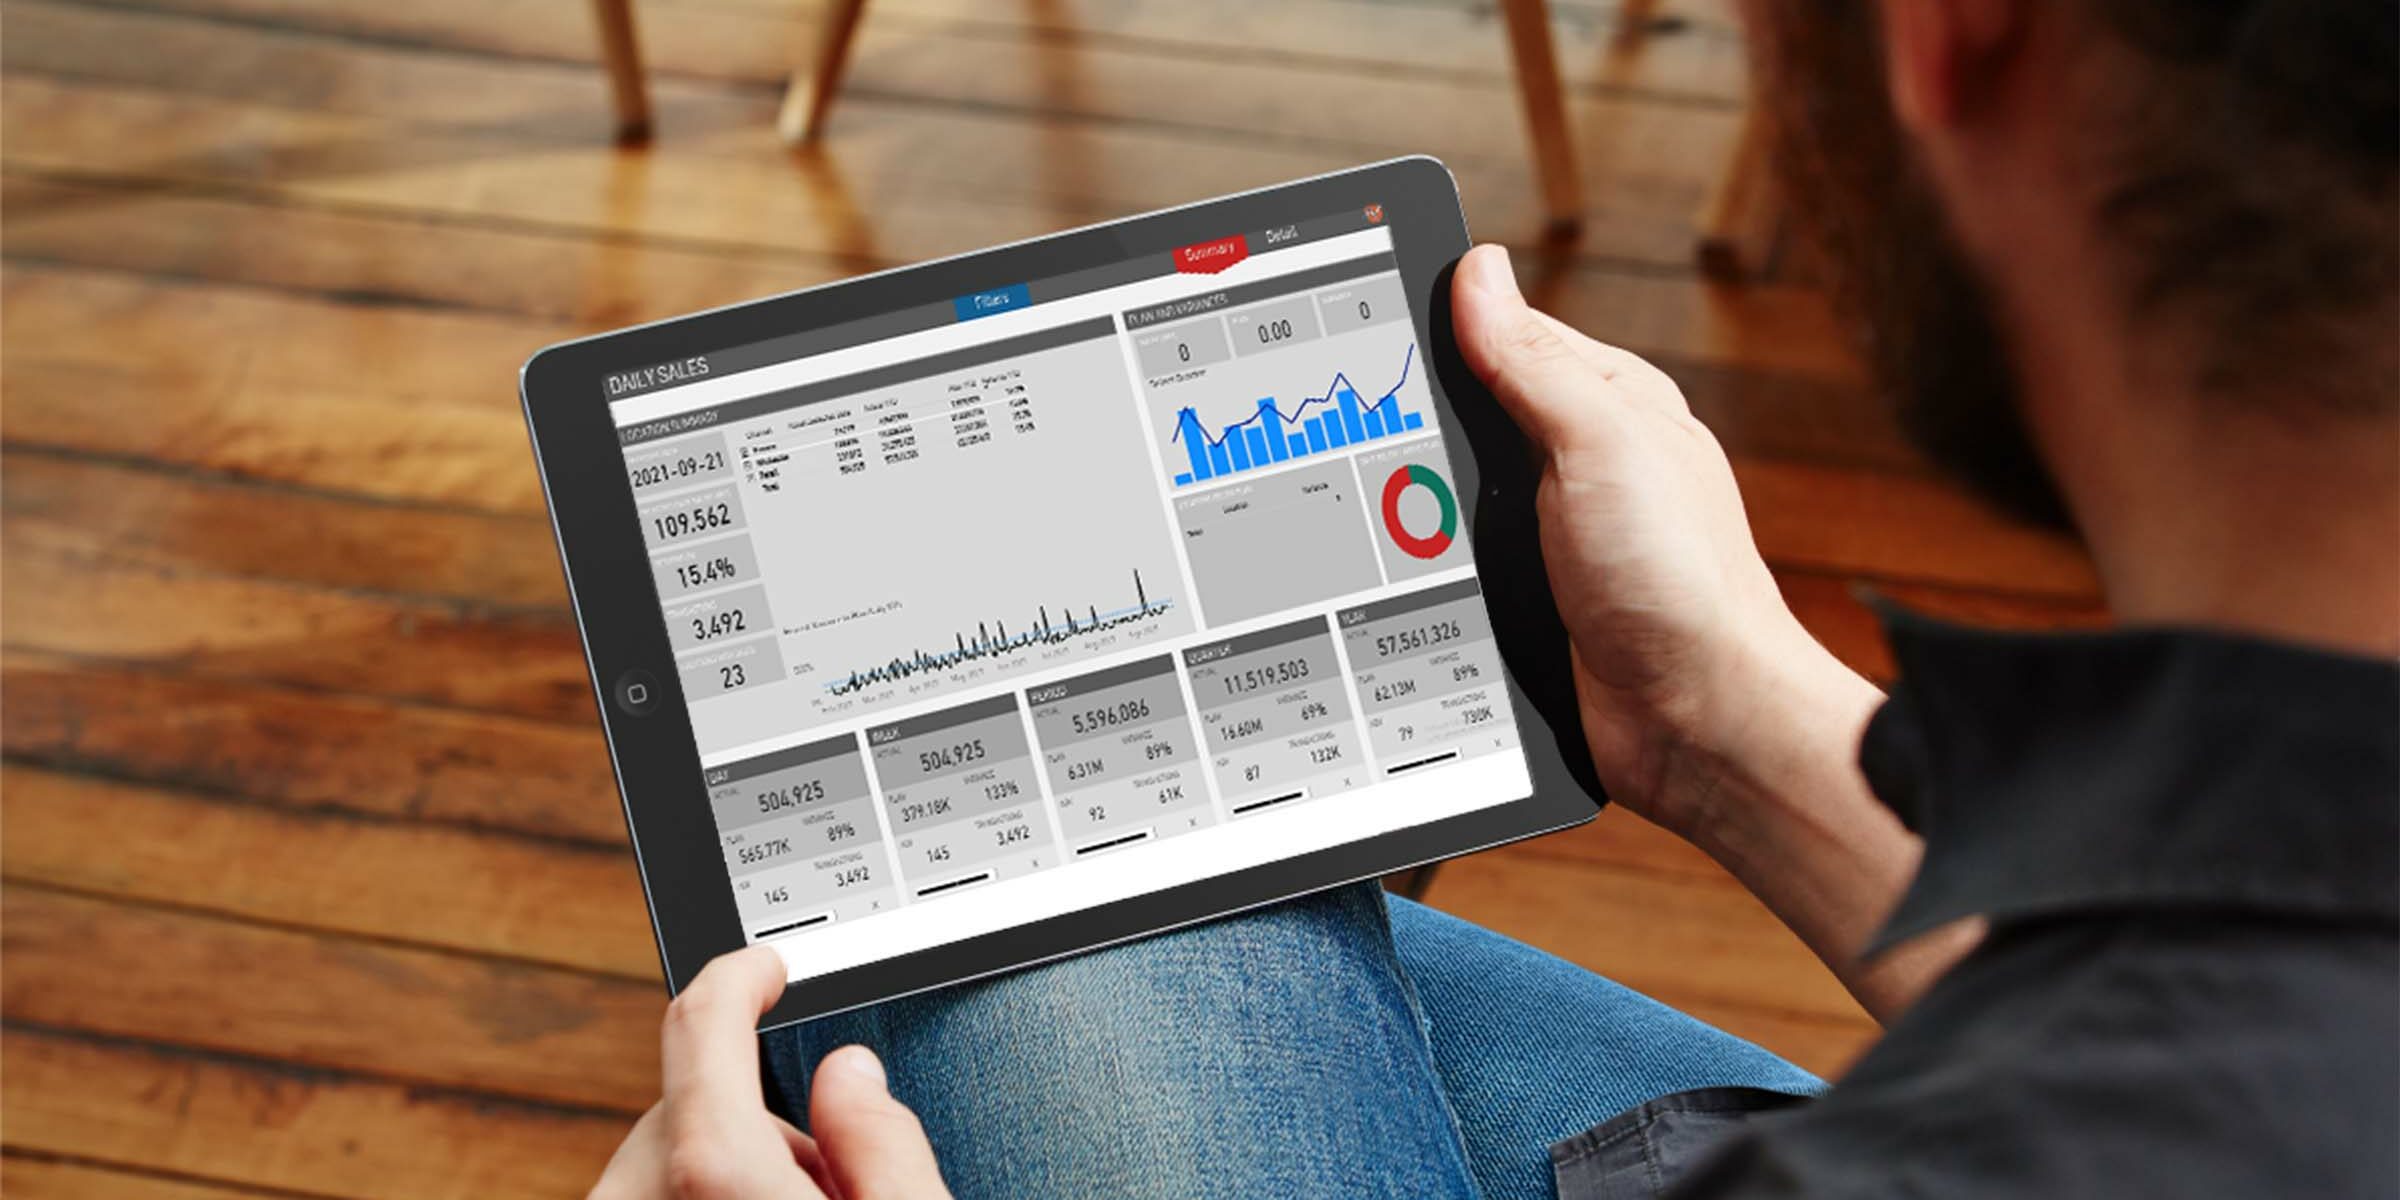
The reports deliver the business-building insights you’re looking for. These easy-to-understand, dynamic, visual reports reveal the patterns that will revolutionize your decision-making. These reports can be customized to your KPIs and include Financials, Management, Marketing, Supply Chain, Shop/Store analytics, and Vendor Management.